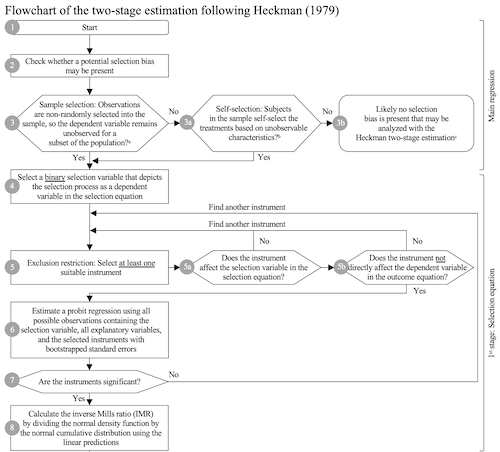
A flowchart, also often referred to as a flow diagram, process diagram, or path diagram, can help better understand the theoretical assumptions and application of the Heckman two-stage estimation. It shows process and decision steps and indicates the flow’s direction. Each step is numbered, allowing an easy reference from the text to the flowchart. All information on the flowchart is placed in either oval-, rectangular-, or hexagon-shaped boxes:
Ovals indicate a start or outcome with one arrow originating from or arriving at an oval, respectively. A flowchart features one starting oval and at least one oval marking the end.
Rectangles represent a process step with each one incoming and one outgoing arrow. Finally, the hexagon-shaped boxes denote decisions.
A hexagon features one ingoing arrow and two outgoing arrows indicating the binary decision option.
Interactive flowchart
There is also a interactive version of the flowchart available. The process of this interactive flowchart can be accessed directly in this browser window. To start the process, click the button below.