In his seminal paper, James J. Heckman (1979) developed a methodology to identify and mitigate sample-induced endogeneity, known as the Heckman two-stage estimation. This technique comprises two consecutive stages, the first of which is applied to separate the selection process from the primary relationship of interest. In the initial stage, the selection process of the underlying relationship is estimated. In the subsequent stage, the primary relationship of interest is analyzed. The connection between the two stages is a unique selection parameter induced from the initial stage and inserted in the second-stage regression. This selection parameter captures unobservable characteristics found in the primary regression's error term that lead to endogenous covariates.
On this page we provide resources about the Heckman two-stage estimation that can be used for teaching, research, or other purposes. Feel free to use these resources. If you decide to use these resources, we ask you to cite our work:
Discussion paper
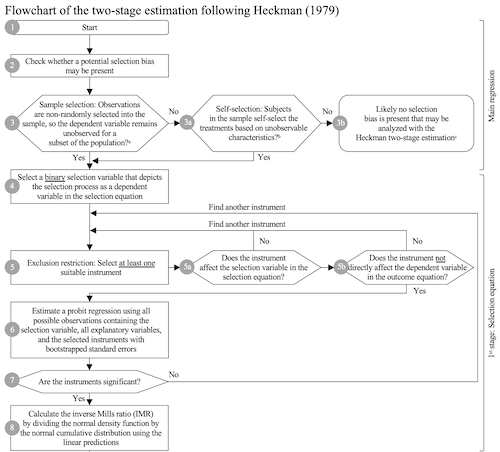
A flowchart, also often referred to as a flow diagram, process diagram, or path diagram, can help better understand the theoretical assumptions and application of the Heckman two-stage estimation. It shows process and decision steps and indicates the flow’s direction. Each step is numbered, allowing an easy reference from the text to the flowchart. All information on the flowchart is placed in either oval-, rectangular-, or hexagon-shaped boxes:
Ovals indicate a start or outcome with one arrow originating from or arriving at an oval, respectively. A flowchart features one starting oval and at least one oval marking the end.
Rectangles represent a process step with each one incoming and one outgoing arrow. Finally, the hexagon-shaped boxes denote decisions.
A hexagon features one ingoing arrow and two outgoing arrows indicating the binary decision option.
Interactive flowchart
There is also a interactive version of the flowchart available. The process of this interactive flowchart can be accessed directly in this browser window. To start the process, click the button below.